Life nowadays moves at a much faster pace, and that rings especially true in the online world. We see that technology is evolving in leaps and bounds, and our demands are naturally increasing in return.
Just think of how far we’ve gone since the dial-up era, which was still the standard about 20 years ago. Our phones are practically mini-computers today, and we can easily host a website for just a few dollars per month. It’s a great time to be an online client, but if you are a site owner – the competition is as fierce as it gets.
So how do you attract more customers? Speed is often a great starting point.
This is a ScalaHosting guide that will teach you more about TTFB – what it is, how to measure it, and how to make ours better.
Let’s waste no time and jump right in…
Table of Contents:
- What is TTFB?
- What Affects TTFB?
- What is a Good TTFB?
- Things to Consider when Measuring TTFB
- How to Measure Your TTFB?
- How to measure TTFB via FTP
- How to measure TTFB via SSH
- How to Improve Your TTFB?
- Conclusion
- FAQ
What is TTFB?

TTFB stands for Time To First Byte and represents the responsiveness of a web server. More specifically, this determines how long it takes for an HTTP request to reach your hosting machine and get back its first byte of data.
The lower the TTFB – the faster your server and underlying websites.
The way your website is structured can have a significant impact on the time to first byte from the get-go. Static pages are typically processed very quickly, while dynamic websites need to load a lot more elements.
TTFB can be incredibly beneficial when analyzing your site performance and identifying its weak points. By fixing whatever is slowing down your server connection, we can not only speed up our pages but also improve their search engine ranking.
What Affects TTFB?

To learn what affects TTFB and how we can influence it, we must first understand what happens when a visitor types a URL and lands on one of our pages.
There are three stages to watch out for:
- Server gets the user request – measuring the time to first byte starts at this stage. This is largely in the hands of your hosting provider.
A few factors work their way around here – the host’s network latency, the distance between user and server, the time it takes for a DNS lookup, complex firewall rules, and more. From a user’s perspective, your internet service provider’s (ISP) speed can also be a culprit when checking what slows down your TTFB. - Server processes the request and generates a response – here is where the cleanliness of your code also makes a big impact on TTFB. Once it gets the visitor’s request, your hosting server has to take care of it. This involves making calls to the database, running scripts, and communicating with other systems in the network.
While website slowdowns here may be caused by insufficient server memory or disk I/O, more often than not, the TTFB is affected by bloated code, poor optimization, lack of page caching, or too many third-party tools and services. - User browser gets the response – it’s not time to get the information back to the user. This is the part that is responsible for about 40% of your TTFB and relies on the fast connection speed from both parties – host and visitor. An example of that are Wi-Fi hotspots that can only ensure basic internet speeds, far from enough for loading dynamic websites in a quick manner.
To summarize it all, we have a few key reasons for slow TTFB:
- Network problems (latency, connection speed, data center location)
- Server problems (insufficient system resources, PHP/ASP settings, type of hosting server)
- Client-side problems (slow code, heavy database, too many third-party integrations)
What is a Good TTFB?
As we mentioned, how you build your website can very much affect your TTFB and your entire loading time. A static site will always load faster than a dynamic one, even if it contains a larger number of pages or gets more requests. Same with your web visits – the more requests you get at once, the longer it will take your server to process them all.
Still, it’s good to have a base point, some numbers to strive for.
We measure TTFB in milliseconds. If your time to the first byte stops the clock below 100ms – you are doing excellent and ranking among the fastest websites out there. A score below 500ms is also good, although you want to stay near the lower margins here (around 100-200ms).
Now, if your TTFB is near or above 1s, that might be concerning and worth looking into. Such a slow server processing speed can cause issues not only with your visitors but with search engines as well.
IMPORTANT: Static website requests can easily be processed within 100ms, but that is not the case with dynamic pages that contain many more elements. A typical TTFB for such a site, even when optimized, would be around 200-300ms.
Things to Consider when Measuring TTFB
There are a plethora of tools around the internet that can analyze your page loading speed and show you how fast it performs. Advanced solutions don’t just stop there – they can give you a full breakdown of the loading time of each of your page elements and useful tips on how to optimize your website for even better results.
Among the most popular tools for site analysis, you will find GTMetrix and Pingdom. Both have proven to be reliable and offer a good range of testing locations. Alternatively, many people seem to like platforms like WebPageTest and ByteCheck because of their simplicity and user-friendliness.
Still, benchmark results from third-party tools will always suffer from deviations and false positives. Here is why:
- Server location – online speed checkers can measure your site speed from various server locations. While they try to cover most major international cities, they are still somewhat limited. Both GTMetrix and Pingdom offer only 7-8 different locations, and if your hosting server isn’t close to any of them – that might add up to your results.
- Server load – imagine that hundreds of people are trying to check their site speed simultaneously. This will inevitably put a load on the testing server, which is why your end results may vary. Even if you test your pages using the same tool with only minutes apart – you might notice a significant difference.
- Scope of measurement – it’s good to consider that speed tests measure the entire process of your full website load, not just the TTFB. Some tools give a more detailed breakdown where you can extract only the time to the first byte, but keep in mind they may use different terminology and visualization methods.
IMPORTANT: When using online tools, it’s good to test your website through multiple platforms and at different times of the day. Forming an average TTFB score would be much more accurate and would help you avoid false positives.
How to Measure Your TTFB?
There is another trick to measure your TTFB and loading speed that doesn’t involve third-party tools and random analytics software. By creating a blank .php file, you can easily calculate the TTFB of your server without including the scripts and plugins that add up to that metric.
Here are three different ways to do that.
How to measure TTFB via File Manager
Naturally, using the in-built File Manager in your control panel would be the quickest way to test your speed.
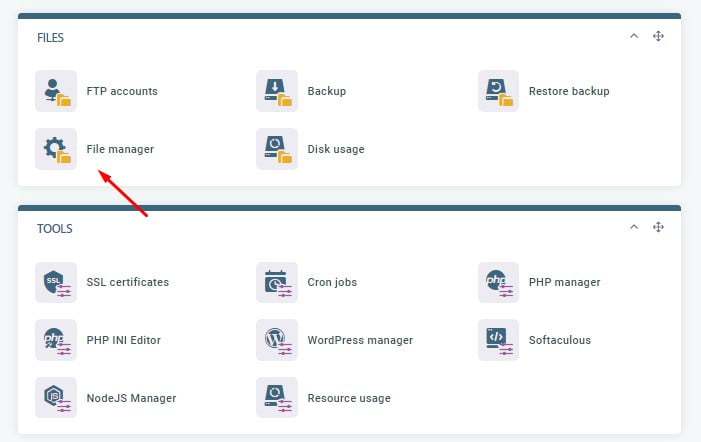
- Log in to your Control Panel and go to File Manager.

- Click on the New File option and create a .php file with the name of your choice.

IMPORTANT: Make sure you are creating a .php file and that you place it in the root directory of your account. This is essential to get the most accurate results.
- Right-click on the newly-created file and click on Edit.
- Once inside, paste the following code:
<?php
phpinfo();
?>
- Click the Save button.
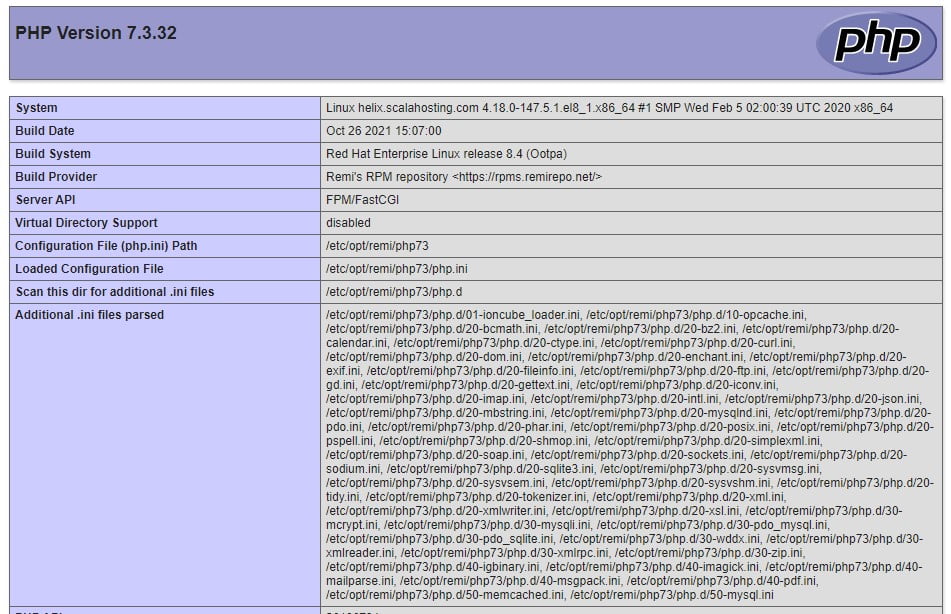
- Open your browser and type yourdomain.com/yourfile.php. You should see such a page:

- This only gives you the PHP information for your server. To run a TTFB test, choose the website analyzer of your choice and check the URL yourdomain.com/yourfile.php
How to measure TTFB via FTP
If you are operating your account through an FTP tool like Filezilla, you can easily create the same file with the steps above. All you need to do is:
- Open your FTP client and log into your server.
- Navigate to the public_html directory and create the new .php file.
- Open the yourdomain.com/yourfile.php URL in your browser.
How to measure TTFB via SSH
More advanced users can measure their TTFB and page loading speeds via SSH (secure shell access) as well. Here is what the procedure involves:
- Open your SSH terminal.
- Enter your root folder with the following command:
cd /home/username/public_html
- Creating the file takes nothing more than a single line as well:
echo ‘<?php phpinfo();’ > info.php
- You can now go ahead and load the phpinfo page in your browser.
IMPORTANT: If you have already tested your website through an online checker, you can compare the results with the TTFB benchmarks of your server alone. Simply open the third-party analyzer of your choice and run a test for the URL yourdomain.com/yourfile.php.
How to Improve Your TTFB?

By this point, we have already learned what affects your TTFB, what is a good score to aim for, and how to measure this important metric. Now it’s time for some practical advice – some tips and tricks on improving your time to first byte.
Here are some essentials to consider:
- Implement caching – this is a must-have for any website powered by dynamic content. Caching helps you create and keep copies of your essential page elements, so your server doesn’t have to look for them every time it gets a user request.
Many applications, like WordPress, offer handy website caching plugins that you can easily configure for the job. VPS and dedicated server clients can also achieve that with some configurations to the .htaccess file, but you should only use that if you know what you’re doing.
IMPORTANT: There are different types of caching, and they can all help you improve your TTFB and loading speeds. Apart from site caching, you can consider browser caching, server caching, micro caching, and more.
- Choose a reliable provider – your hosting provider plays a pivotal role in getting good TTFB marks from the get-go. Many hosts may utilize similar server machines but how they configure them makes the real difference. Check if your potential provider offers a free trial or some kind of a demo so you can test the server speeds and see if they are satisfactory for your project.
- Utilize a CDN – a CDN (or content delivery network) helps you optimize your site speeds if your visitors are coming from different parts of the world. Similar to caching, instead of your server searching for a response to every request, you can save copies of your static elements in a global network of interconnected servers. This way, you are reducing all the latency involved when data “travels” long-distance.
Conclusion
Being aware of how your website performs at all times is detrimental to your optimization strategy and business growth. Any good webmaster knows this is an ongoing process, and they should always be looking for new ways to reduce their project’s TTFB and page load.
Optimizing your site speed is a shared responsibility between you and your service provider. Whenever you see something is slowing you down, make extensive preliminary checks to see what is causing the issue.
ScalaHosting puts great effort into reaching a maximized server performance, and you can always contact our Customer Service team to see what options we may find for you.
FAQ
Q: What causes high TTFB?
A: When it comes to your website type, dynamic content pages will always cause slower speeds than static ones. But that is far from the only reason. Among the possible culprits, you can consider – poorly-coded app/website, slow hosting provider, distant datacenter location, lack of caching mechanisms, and more.
Q: How is TTFB calculated?
A: There is an easy way to check your page loading speed and the components that add up to the grand total. Simply right-click on the page you wish to analyze and select the Inspect option. This will reveal a new menu at the bottom that you can expand to your liking.
Click on the Network tab and then hard refresh your page (ctrl+R on Windows and cmd+R on Mac). If you now go to the Timing tab, you will see the speed breakdown and the exact TTFB in milliseconds.
Q: Does a CDN help reduce TTFB?
A: A CDN does wonders for caching static files. While that may not seem like a great deal for your homepage and other sections where you may have lots of dynamic elements, the overall time you will save by just caching the static files can help you reduce TTFB by up to 85%.


